TechWire

Category - Infographic

IT Jobs with the Highest pay and the Fastest Growth

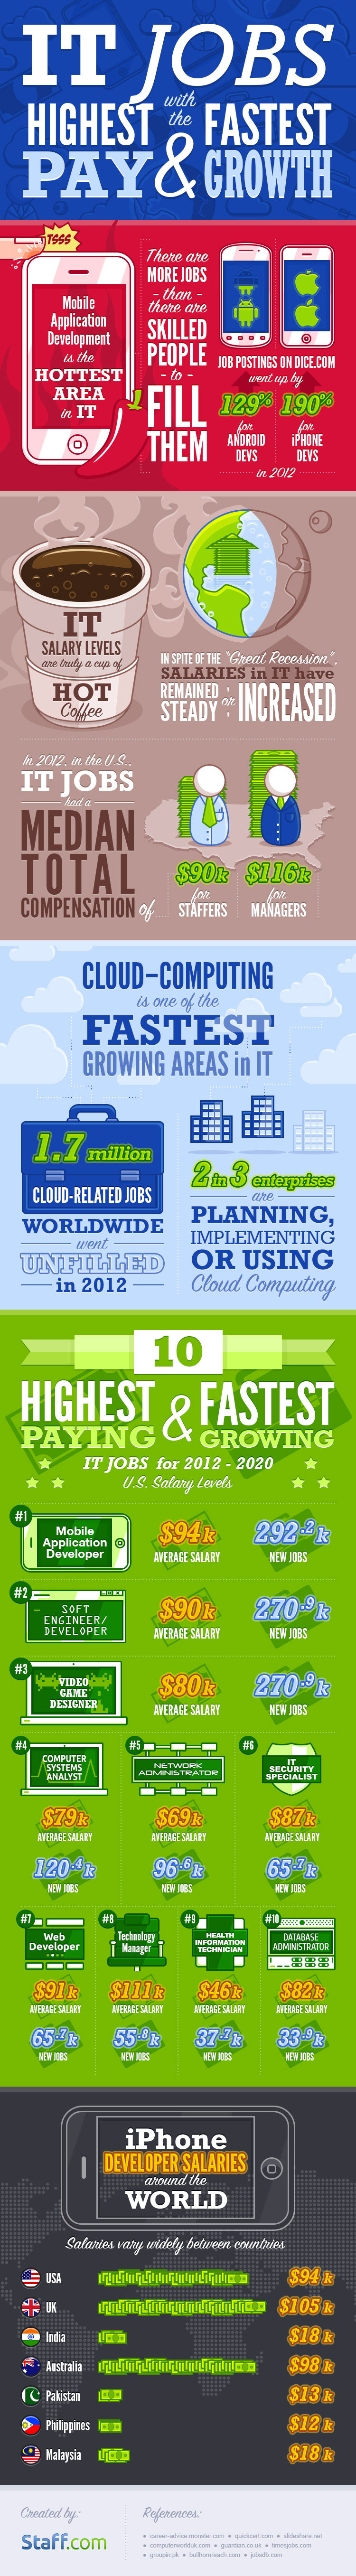
With the rapid technological advancements, the IT field is becoming a popular career path. However within the IT field there are many domains of work according the area of expertise. In each of these domains, the salary and the future opportunities vary. The below infographic gives a breakdown of highest paying and fastest growing areas. Even though this is based on US data, it would give us an understanding on which jobs hold the highest potential locally for the future. (Infographic credits : Staff.com)


IT_Jobs

Exploring the mobile landscape – InfographicExploring the mobile landscape – Infographic

The mobile space is getting important by the day as it is becoming an essential part of peoples lives. From interacting with people to buying goods to playing games, mobile phones keep finding various areas which it adds value and thus making its usage soar. The below infographic shows the impact of the mobile landscape and also how it is used. (Infographic credits to New Relic)

Mobile Appeal

  ජංගම ලෝකය දිනෙන් දින සීඝ්‍රයෙන් වර්ධනය වන බව අපි දන්නෙමු. මිනිසුන් සමඟ කත බස් කිරීම , පරිබොගික භාණ්ඩ මිලදී ගැනිම, games සෙල්ලම් කිරීම වැනි ක්‍රියාකරකම් රැසකට ජංගම දුරකථනය භාවිත වේ. පහත දක්වා ඇති දත්ත රුපයෙන්(infographic) ජංගම දුරකතනය සිදු කල ඇති වෙනස දැක ගත හැකිය.

Mobile Appeal


Maximize your Tweets – Infographic

Did you know that tweeting on specific days or limiting tweets to a certain number of characters can increase user engagement significantly? If your handling a brand twitter account, you might want to check the below infographic to #maximize your tweets. (Infographic by Buddy Media)
tweets

The Internet a Decade Later – Infographic

It is fascinating how the internet has progressed in the last 10 years while providing us information and entertainment in ways we couldn’t have imagined. The below infographic displays the turnaround in the internet considering many aspects. It also highlights the importance of businesses adapting to the internet in order to survive. (Infographic created by www.bestedsites.com)

A decade of Internet

The Galaxy S Evolution – Infographic

It all started with Samsung launching the Samsung Galaxy S android smartphone in 2010, which had decent sales. They improved on it with the Samsung Galaxy S2 and had even more success with the Galaxy S3. Now with the release of the Samsung Galaxy S4, will the Galaxy S series become the most popular smartphone series in the world? I guess we will have to wait and see. Meanwhile, take a look at the below infographic on the evolution of the Galaxy S series.

Samsung Galaxy S Evolution

App Store Optimization – Infographic

With the rapidly populating app stores, it is an essential for you to look into app store optimization to improve the visibility of your app. The below infographic gives you 3 reasons why you should focus on app store optimization and best practices involved. Take a look!

App Store Optimization

Google the Split Second Search

With an instant search preview loading in 1/10th of a second, an index well over 100 billion gigabytes large built over 1 Million computing hours, Google is truly jaw dropping. The below infographic shows how a google search works and some useful stats behind it.

google_search

The History of HTML5

It all started in 2004, when Apple, the Mozilla foundation and Opera Software came together to develop HTML5. From 2008 when its first version was published till today, HTML5 has come along away into our digital lives. Check out what happened in between through the below infographic on the History of HTML5.

History of HTML5

Web trends for 2013

A simple but powerful infographic on the web trends that will become mainstream in 2013. Some of these trends you can already see surfacing through the more recently launched sites. Any other web trends that you think will be important to note down for 2013?
2013Trends_Webs

The Rise of Android in 2012

With over 500 million activated devices, 1 billion dollars in 4th quarter revenue, and finally matching the number of apps available in the apple App store, 2012 was a year to remember for Android. Find out more of Androids achievements in 2012 down below.

The rise of android in 2012

Social Media Statistics 2013

Found this very informative infographic on Social Media in 2013 covering Facebook, Twitter, Google+, Instagram, and Pinterest. Surprised that 25% of users still neglect privacy settings, while 5 million images per day from instagram is an insane amount of images. Check out the rest of the facts down below.

2013-social-media-stats